PV Performance Monitoring on Openmetrics
What is PVGIS?
The Photovoltaic Geographical Information Survey, or PVGIS, is a database model of solar irradiation and light levels across Europe. Openmetrics uses this information to accurately predict the yield of solar photovoltaic power plants to compare against actual meter readings received from smart meters.


One PV performance ratio to rule them all
OpenMetrics needs to know some details about each solar installation before a performance ratio can be calculated from PVGIS. The location, system size in peak kWh, slope of the panels, and azimuth are used to find the estimated energy yields for each month of the year. Actual meter readings collected from the smart meter are compared against predicted yields to return a performance ratio. This is a percentage of performance indicating whether the PV system is above or below the PVGIS prediction.
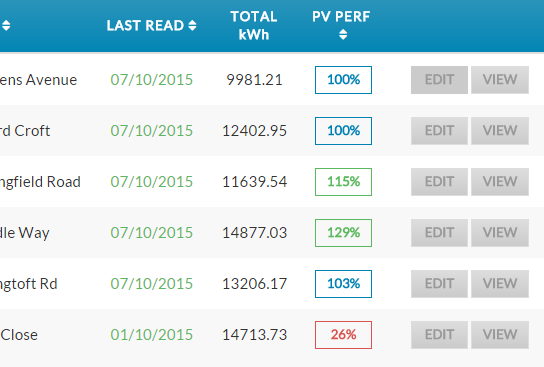
A system that is over performing compared to PVGIS will have a % greater than 100, and a system that is underperforming will have a % less than 100. OpenMetrics makes it easy to identify systems that are underperforming, possibly due to shading issues, or underperforming inverter, or other system fault. A performance ratio of below 75% at the end of the month warrants further investigation of the system.
The performance ratio is based on meter readings since the start of the current calendar month. Calculating the ratio in this way may seem illogical however it means that at the end of the month you have an accurate and stable indication of system performance. The downside of this is that in the first 10 days of the month the performance ratio can vary wildly due to fluctuating weather conditions. This is the accepted method in the solar industry for monitoring system performance, in order to create end of month reports.
How to enable PVGIS for a PV generation meter
To enable the PVGIS performance features on OpenMetrics, follow these steps:
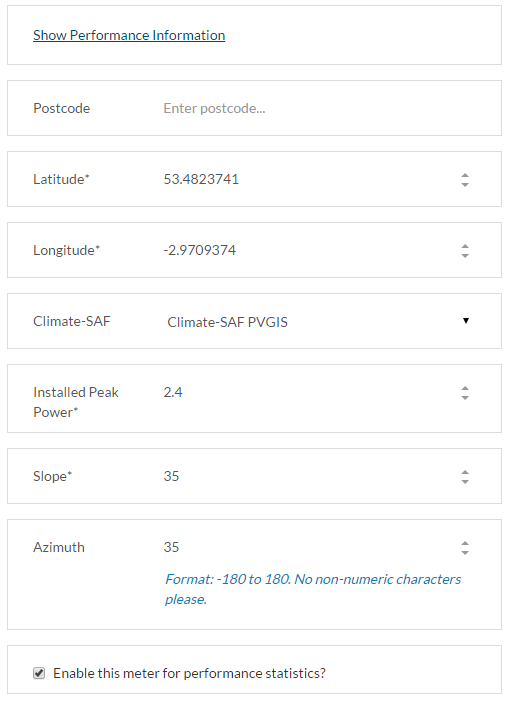
Go to Edit from the Meter Information page or from the dashboard. Expand Show Performance Information to reveal the PVGIS fields. Enter the location post code or longitude/latitude, the PVGIS database to use, kWp, slope, and azimuth. is the facing angle relative to South. E.g. a South facing system has an azimuth of 0, east facing of 90. Pick the Climate-SAF database you wish to use:
- Classic PVGIS
- Climate-SAF
- PVSOL
More information on the different PVGIS databases.
Then click the checkbox to enable this meter for performance statistics. Finally click Save Meter Data at the foot of the page.
The Edit page will reload and now show a table of monthly predicted yields for the current year.


Analysing Historic PVGIS Performance
The performance charts can be accessed from the dashboard by clicking on the performance ratio in the PV PERF column. Also from the meter information by clicking the performance percentage below the main chart area.
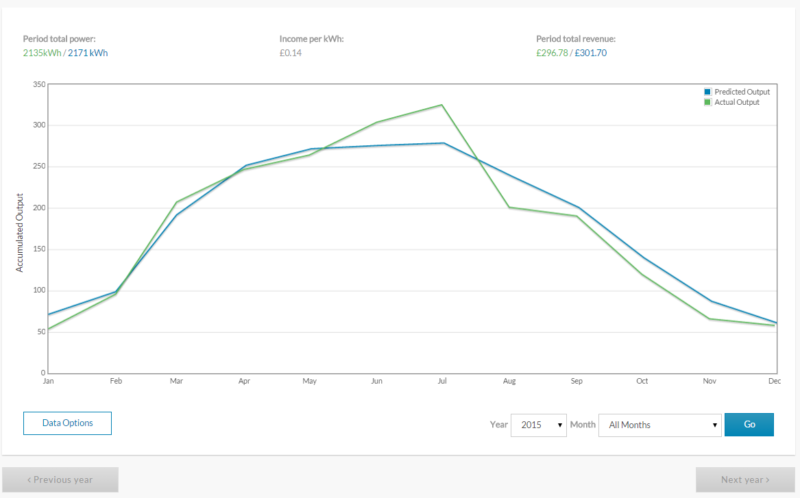
This open a new page which charts the predicted yields against actual system yields for the current calendar year. The currently viewed data range can be changed by selecting the to and from dates in the drop down box. Or to view the day-by-day chart for an individual month, select the month and year from the drop down box, then click Go.
