[vc_row][vc_column width=”1/1″][vc_column_text]The OpenMetrics Web Portal has recently been updated to bring new enhancements to the user interface and introduce new tools for analysing energy performance. These changes have been rolled out to all users and affect all types of meters being used for generation and import/export monitoring.
Summary of updates:
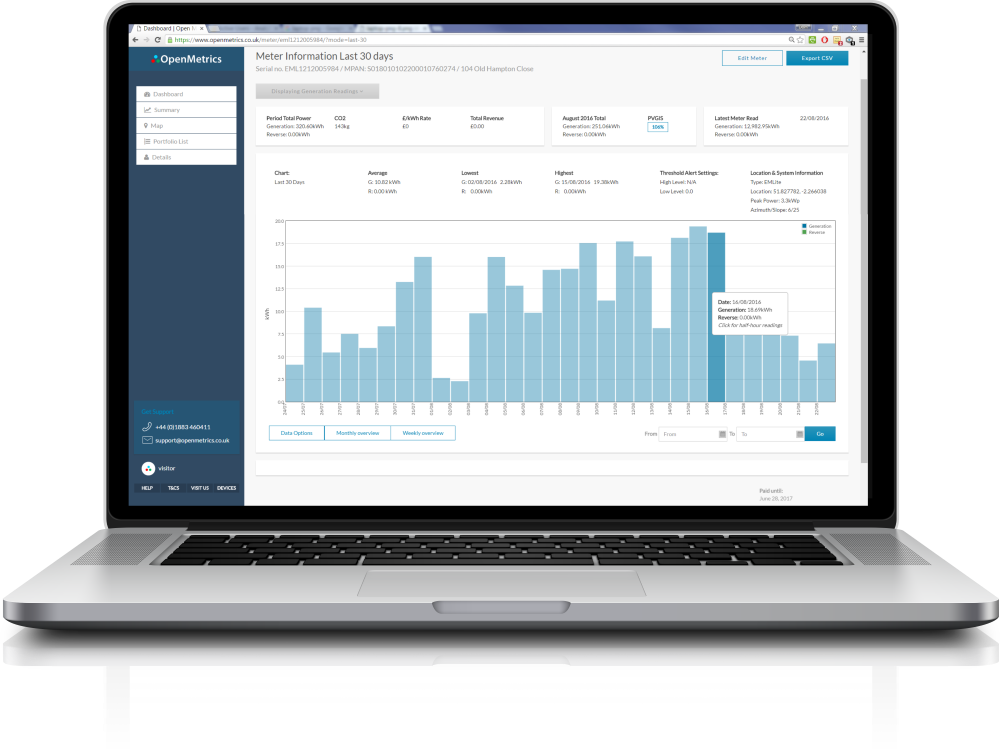
- Improved layout of Meter Information page
- Meter details and threshold alerts shown
- Average, minimum and maximum values shown for daily,weekly and monthly energy totals
- Cumulative current month energy total shown
- System performance ratio
- Generation statistics on solar output
- Peak solar performance
Some of these new features are only shown when viewing the individual day’s data where half-hour profile is charted. These statistics are specific to the energy yield on that day.[/vc_column_text][/vc_column][/vc_row][vc_row][vc_column width=”1/3″][text-with-icon icon_type=”font_icon” icon=”icon-sun” color=”Accent-Color”]
Generation Statistics
There is now a group of useful statistics for monitoring solar generation meters that show how many hours of generation there have been and the time when the solar system started and stopped generating.[/text-with-icon][milestone symbol_position=”after” color=”Extra-Color-2″ number=”15″ subject=”Hours of Generation”][milestone symbol_position=”after” color=”Extra-Color-2″ number=”7″ symbol=”:00″ subject=”Sunrise”][milestone symbol_position=”after” color=”Extra-Color-2″ number=”22″ symbol=”:00″ subject=”Sunset”][/vc_column][vc_column width=”1/3″][text-with-icon icon_type=”font_icon” icon=”icon-arrow-up” color=”Accent-Color”]
Peak Output
The peak output is the maximum output recorded at any time during the day. This is the actual rate of energy rather than the total yield in any time period. The peak output is also used to calculate the system performance ratio by comparing against the system installed capacity. The time of the peak kWh is also used to show when the solar system was performing at its best. For consumption or export meters, the peak import or export is shown here instead.[/text-with-icon][milestone symbol_position=”after” color=”Accent-Color” number=”92.1″ symbol=”kWh 13:00″ subject=”Peak Measured Generation”][/vc_column][vc_column width=”1/3″][text-with-icon icon_type=”font_icon” icon=”icon-signal” color=”Accent-Color”]
System Performance
The system performance is a ratio of peak recorded output against maximum installed capacity. The system size is reduced by 14% to account for typical system efficiency losses. This provides a realistic indication to show to what extent output is reaching is full potential. On a sunny day in the middle of summer this should occasionally hit 100%.[/text-with-icon][milestone symbol_position=”after” color=”Extra-Color-2″ number=”87″ symbol=”%” subject=”of Peak Solar Capacity”][/vc_column][/vc_row][vc_row][vc_column width=”1/3″][text-with-icon icon_type=”font_icon” icon=”icon-resize-vertical” color=”Accent-Color”]
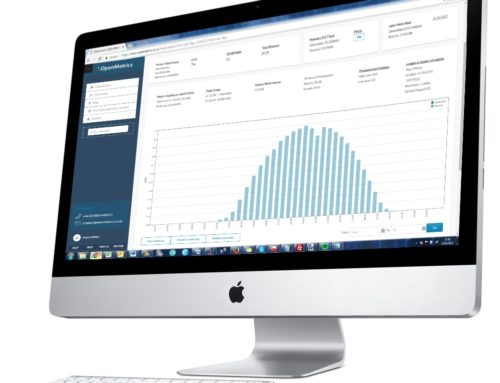
Highs & Lows
The Openmetrics energy totals graph shows the maximum, minimum and average generation totals for daily, week and monthly charts. These stats are also available for import/export meters and twin element meters that have import/export/generation/net consumption totals. Click on the values to jump to the specific day’s half-hour data to view in more detail.[/text-with-icon][/vc_column][vc_column width=”1/3″][text-with-icon icon_type=”font_icon” icon=”icon-th-list” color=”Accent-Color”]
Location & System Information
For added convenience the details and meter type are shown above the main charting area. These can be edited in the usual way by going to Edit Meter. We strongly recommend entering system information and location for using the PVGIS performance benchmarking tools available for generation meters.[/text-with-icon][/vc_column][vc_column width=”1/3″][text-with-icon icon_type=”font_icon” icon=”icon-exclamation” color=”Accent-Color”]
Threshold Alert Settings
The minimum and maximum threshold settings can be set from the Edit Page along with other system details. This simply shows the current threshold settings for the meter that will raise an alarm if energy exceeds or goes below on any day.[/text-with-icon][/vc_column][/vc_row][vc_row][vc_column width=”1/1″][vc_text_separator title=”Screenshots with captions” title_align=”separator_align_center”][image_with_animation image_url=”4209″ animation=”Fade In” img_link_target=”_self”][image_with_animation image_url=”4211″ animation=”Fade In” img_link_target=”_self”][vc_row_inner][vc_column_inner width=”1/2″][vc_text_separator title=”Contact” title_align=”separator_align_center”][vc_column_text]Use the contact form below to request a demonstration. Someone will be in contact with login details to view the demonstration account that has a selection of GPRS smart meters monitoring solar PV systems, wind turbines, EV charge points, export meters and twin element meters.[/vc_column_text][contact-form-7 404 "Not Found"][/vc_column_inner][vc_column_inner width=”1/2″][/vc_column_inner][/vc_row_inner][/vc_column][/vc_row]